Outline
Total Harmonic Distortion (THD)
The graph below shows the THD+N vs output power with 300 Ω load. The amplifier delivers 250 mW at the onset of clipping. Note that the sharp jumps (aside from when the amplifier clips) are caused by range switching in the Audio Precision APx525 audio analyzer used for the measurement. The THD+N vs output power plots mostly show the THD+N floor of the measurement system.

Repeating this measurement with 32 Ω and 20 Ω load results in the following:


Even at these heavier loads, the THD+N of the HPA-1 is still below the measurement limit of the APx525. The HPA-1 reaches clipping at 1.2 W and 1.5 W into 32 Ω and 20 Ω, respectively.
Headphones with an impedance below 32 Ω have started to appear in the market. Thus, I characterized the performance of the HPA-1 with various loads, including 12 Ω. The result is shown below.

As seen on the graph, it is only with 12 Ω load that the THD+N of the HPA-1 exceeds the noise floor (measurement limit) of the Audio Precision APx525 audio analyzer.
The THD+N vs frequency plots for 100 mW into 300 Ω and 100 mW into 32 Ω are shown below. Note that the measurement bandwidth was changed to 60 kHz to capture at least three harmonics of the test signal. This also increases the noise bandwidth, hence the THD+N, of the measurement.


Intermodulation Distortion (IMD)
Single-tone distortion tests, such as THD+N measurements, are useful to determine fundamental amplifier performance and behaviour. However, some criticize these tests as being too simplistic to properly describe the amplifier's behaviour when presented with a more complex signal, such as music.
Intermodulation tests address this by using two or more test tones. The gold standard among these tests is the 32-tone test developed by Audio Precision. I was among the first to use this test for amplifier characterization, and other vendors have started to follow suit.
The Audio Precision 32-tone IMD test uses 32 test tones of equal amplitude, logarithmically spaced in frequency. The phase of the test tones have been designed to provide a crest factor of 10 dB, which is quite representative of music. The signal itself sounds a bit like an out of tune pipe organ.
The graph below shows the result of the 32-tone IMD test with the HPA-1.

The combined amplitude of the 32 tones is the 0 dB reference, and corresponds to 100 mW into 300 Ω. The intermodulation products - i.e. the "grass" between the test tones - are distortion products from the amplifier. These should be as low as possible. As seen in above graph, these distortion products are 140 dB (10,000,000×) lower than the reference level, which is truly stellar. Thus, even with a complex input signal, the HPA-1 does not add any audible colouration to the input signal. It is a truly transparent amplifier. The transparency of the HPA-1 is supported by the two-tone IMD tests as well.
Siegfried Linkwitz has proposed a 1 kHz + 5.5 kHz IMD test, which he argues to be highly indicative of the perceived sound quality. He bases his argument on the fact, that IMD products in this measurement fall in the frequency range where the ear is the most sensitive (see the Fletcher-Munson curves for more detail). This seems like a reasonable argument, so I measured the HPA-1 accordingly.
The result of this measurement is shown below. Note that due to a limitation in the signal source of the APx525, the frequencies used must be an integer multiple of each other. Thus, my test signal consisted of 917 Hz (5500/6) and 5.5 kHz at equal amplitude. I performed this measurement at 1.0 mW as this is representative of typical listening levels with most headphones. The result is shown below.

Aside from the third order intermodulation product (d3), the IMD products are indistinguishable from the noise of the measurement equipment. Excellent!
The two more traditional IMD measurements are the SMPTE 60 Hz + 7 kHz (4:1 amplitude ratio) and the 18 kHz + 19 kHz (1:1 amplitude ratio). The former is often used to tease out thermal issues within the amp. The latter often reveals lacking loop gain (so basically lack of control) towards the higher end of the audio frequency range.
The SMPTE IMD test result for the HPA-1 is shown below.

Only the second (d2) and third (3d) order IMD product extend above the noise floor.
The result of the 18+19 kHz IMD measurement for the HPA-1 is shown below. Only the third order IMD product (3d) extends above the noise floor.

Noise
With its integrated power supply, the HPA-1 does show a little bit of rectifier hum below -130 dBV as shown in the plot below. The total integrated noise measures 1.25 µV (A-weighted). Needless to say, the residual mains hum and noise is well below audible.

Some may worry about the presence of ultrasonic noise from the switching power supply. There is no need to worry, however. The plot below shows that the output of the HPA-1 is absent of ultrasonic noise.

Amplitude Response, Channel Separation, Common-Mode Rejection, Etc.
For completeness, I measured the amplitude response of the HPA-1 for its two gain settings along with its gain flatness. The results are shown below.


The channel separation as indicated by the crosstalk between channels of the HPA-1 is shown below. The channel separation is dominated by the little bit of shared ground impedance in the 1/4" phone output jack and exceeds 98 dB within the entire audio band.

The volume control in the HPA-1 is a high-end ALPS RK271-series "Blue Velvet" potentiometer, which is well-established in the audio industry as a state-of-the-art volume pot. Yet, some are still concerned about channel imbalance in potentiometer-based volume controls.
To address these concerns, I measured the channel imbalance and attenuation as function of potentiometer rotation. I turned the volume manually for 30 seconds with as constant a rotational velocity as I could. I measured the resulting gain and channel imbalance throughout this time. The result is shown below.

As seen in this graph, the channel imbalance is within ±0.57 dB throughout the attenuation range of 0-60 dB. It is only at the last few degrees of volume knob rotation near the minimum setting that the channel imbalance exceeds this value.
The common-mode rejection ratio of the differential input of the HPA-1 is shown below. As shown in the plot, mains hum that appears common-mode on the differential input will be rejected by over 70 dB (3,200×).

Transient Response
The measurements above all characterize the amplifier in the frequency domain. Transient response measurements describe how the amplifier performs in the time domain.
Amplifier stability is paramount, and achieving good stability in an amplifier featuring a high-speed composite output stage can be a significant challenge. Thus, I characterized the transient behaviour of the HPA-1 for various reactive loads.
The oscilloscope screen shot below shows the transient response of the HPA-1 when presented with a 10 kHz square wave and loaded by 300 Ω in parallel with 470 pF of capacitance. This load is representative of a pair of Sennheiser HD-650 with the stock cable and a 2-3 m (~10') extension cord.

As shown above, the transient response of the HPA-1 is exemplary and shows no tendency to overshoot.
Increasing the capacitance to 1.0 nF (Sennheiser HD-650 with the stock cable and an 8 m (~26') extension cord) still shows a clean response.

With 4.7 nF (Sennheiser HD-650 + stock cable + 45 m (~147') extension cord), a very slight degradation of the transient response is observed in the form of a slight smearing of the edge. The amplifier still shows no signs of instability, as no ringing or overshoot is present in the measurement.

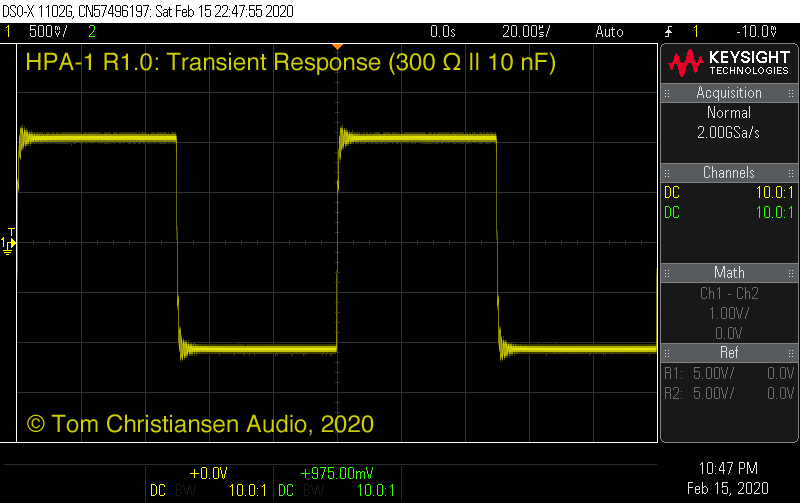
Finally, when loaded with 10 nF, the amplifier finally shows slight overshoot and ringing. Note, however, that to obtain such capacitive load in actual use would require approximately 100 m (300') of extension cable on a typical pair of headphones. It is also noteworthy that the HPA-1 remains stable even with 100 nF capacity load. Needless to say, I have full confidence in the stability of the HPA-1.

Another important stability consideration of an amplifier is its stability as it enters and exits clipping. I, thusly, measured this for the HPA-1. The three oscilloscope screen shots below show the output of the HPA-1 with a sine wave input. The amplitude is gradually increased until it is 1) just below clipping, 2) at the onset of clipping, and 3) clipping hard.
The HPA-1 shows a very slight blip as it exits clipping, but remains completely stable, even when driven hard into clipping.


